MAGPIE Smart Energy Systems Simulator demo
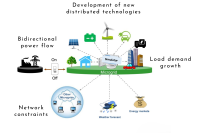
Smart energy systems simulate grid operations to identify congestion risks, support energy planning, and enable sustainable port electrification. This is demo 2 within the MAGPIE project.
Introduction
Value proposition
A decision support tool enables better planning by identifying flexibility needs and congestion risks
It facilitates scenario analysis and informed infrastructure planning, helping ports avoid the costs associated with grid congestion, such as renewable energy curtailment, equipment overloading, operational delays, or penalties for exceeding grid capacity limits
It also helps reduce unnecessary investments and improve overall operational efficiency.
Problem: Ports face increasing electricity demand and congestion risks due to electrification and energy transition plans. Data sharing regulations[NV4.1][FK4.2], lack of stakeholder coordination, and limited access to network data[NV5.1][FK5.2] hinder effective planning.
Port applicability
Detailed description of the solution
Software Tool
Accepts standardized datasets [NV7.1](demand, price, weather) and supports scenario modelling. The software takes as input .csv and/or .pkl files containing demand, price, and weather data, along with the number of scenarios to be generated and the month for which these scenarios are created, as well as the grid configuration. It is developed in a Python environment and integrates Pandapower modeling, power flow analysis, K-Nearest Neighbors Regression (KNN), and Monte Carlo simulations to evaluate the grid’s operation and performance under various conditions, both in its current state and in future expansion scenarios.
Data Integration
Requires access to electricity network data, regional measurements, and governance structures to make realistic simulations.[NV8.1] However, the model can also be executed using any other open-source historical or synthetic dataset.
Scalability
The model is designed to be highly flexible across different time horizons and grid configurations. Its structure follows a functional design in Python, where each component, data input, model execution, and output generation, is modular and independent. The model operates based on user-provided inputs in standardized formats (e.g., demand, price, and weather data), allowing it to run seamlessly with any new dataset as long as it follows the required input structure. This modular design ensures that the framework is not hard-coded or limited to a specific case study, but can be easily adapted to other networks, time periods, or operating conditions, making it scalable and reusable.
Governance
Depends on who owns the network data (port or external entity).
Use Case
The Port of Sines has several planned future expansions; however, in this study, we only considered those that are close to implementation, with clearly defined locations and technical specifications.
Impact
| Impact | Level | Remark |
|---|---|---|
| Energy Efficiency | Medium impact | Provides analytical guidance that supports more economical and efficient energy use and infrastructure planning. |
| GHG emissions | Medium impact | No direct CO₂ reductions, but supports transition from grey to green electricity. |
| Safety | Medium impact | Indirectly improves safety by reducing grid stress and investment risks. |
| Circularity | Medium impact | The following points can be considered as some indirect relevant aspects:
o Supporting informed decision-making that leads to more efficient and economical use of existing grid infrastructure, reducing the need for unnecessary reinforcements or overinvestments.
o Promoting adaptive and long-term planning, which aligns with the principles of circularity by making better use of what already exists before creating new capacity. |
| Port City | Medium impact | Identify probable congestion problems in different operating conditions, improves planning transparency, and supports sustainable development. |
| Nature and Community Impact | Medium impact | Indirect benefits through better infrastructure |
| Avoided investment costs and improved decision-making capacity | Medium impact |
Port characteristics
How to implement?
- Step 1
Data Collection and Preparation – Gathering and structuring demand, price, and weather data for model input.
- Step 2
Grid Structure Modeling – Developing a flexible grid representation adaptable to different configurations and scales.
- Step 3
Future Extensions and Developments Integration – Incorporating planned grid expansions and technical updates.
- Step 4
Scenario Generation Module Development – Creating a scalable tool for generating time- and condition-based scenarios.
- Step 5
Grid Assessment Module Development – Building an analytical engine to evaluate grid performance under diverse operating conditions.
- Step 6
KPI Definition and Calculation – Establishing and computing key performance indicators to assess scalability, efficiency, and resilience.
Implementation Interdependencies
Required involved stakeholders
Network operator/owner
Central actor responsible for managing electricity infrastructure and data.
Port Authority
Service provider and affected party in case of congestion.
Terminal Operators
May benefit from optimized energy planning.
Shipping Lines
Indirectly affected by port energy reliability.
Technology Providers
Develop and maintain the decision support tool.
Engineering & Construction Firms
May use tool outputs for infrastructure planning.
National & International Regulators
Oversee data sharing and energy regulations.
Financial Institutions/Investors
Benefit from reduced investment risks.
Research & Development Institutions
Support tool development and validation.
Local Government & Community Groups
Indirectly benefit from improved planning.
Knowledge base and references
- Canvas – demo 2 presentation
- Smart energy system simulator infographic: www.magpie-ports.eu/wp-content/uploads/2026/06/demo-2-smart-energy-systems-simulator-1.png (opens in new tab)